This patient was an 81-year-old male with history of DMII, HTN, CKD IV & MI (with 11 stents and a 4x bypass, plus an AICD in place) and who presented to the ER with “general illness.” He described sore throat and cough for one week, along with exertional dyspnea.
Workup revealed an abnormal EKG reported as wide complex tachycardia in the 110s with an intermittent narrow complex rhythm. BGL was elevated at over 400, but without evidence of DKA. Patient was noted to be hypotensive and eventually required both fluids and a vasopressor (Norepinephrine at 5mcg/min). He was also treated for community acquired pneumonia. Patient was being transferred for cardiology workup.
This was the EKG that the crew was provided with:
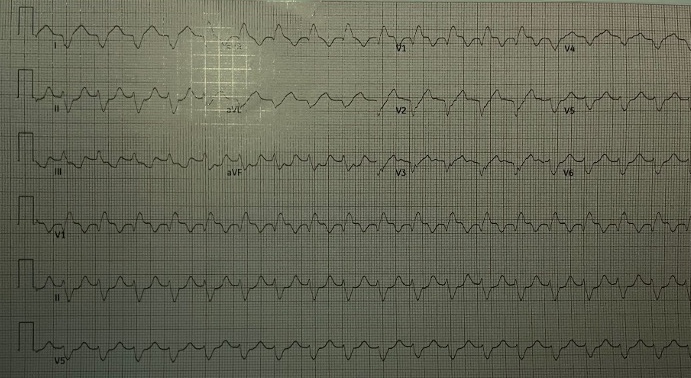
Initial observations on this EKG:
- rate: 110s
- rhythm: regular
- p waves: not seen
- PR interval: n/a
- QRS: wide at .20s
- ST segments: ST depression in inferior leads
- T waves: mostly upright where they’re supposed to be, more or less normal, except for V3 that looks a bit weird
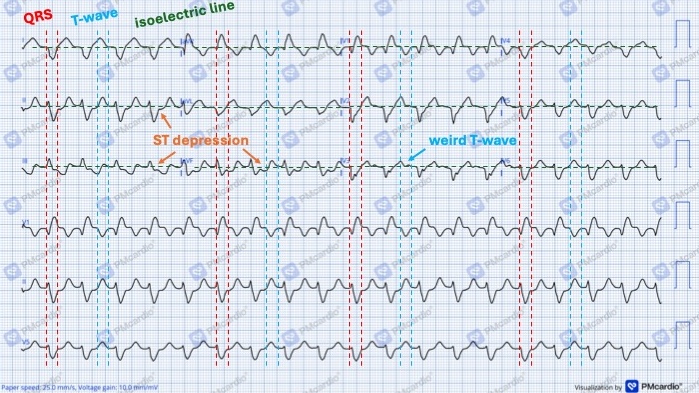
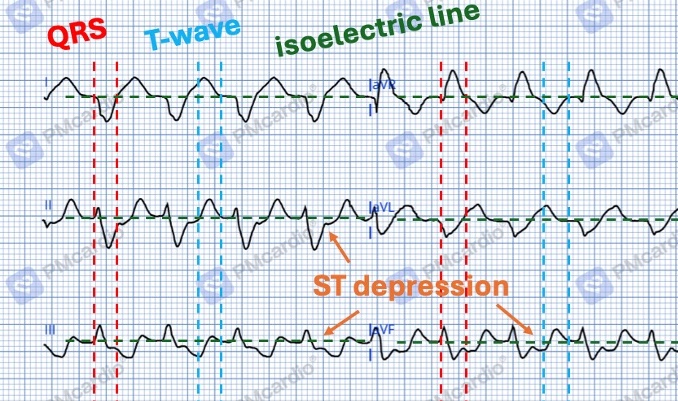
And then here’s a zoom-in on that top-left corner where most of the things are notated:
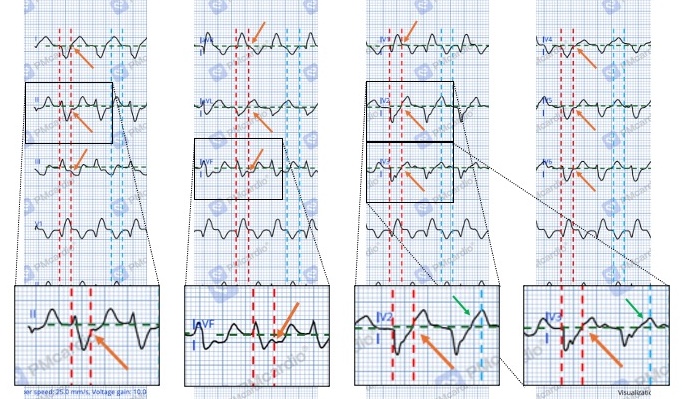
And one more image to try and identify the J-point and any ST changes in different leads. There is some potential, but unconvincing ST elevation in V2 and V3. It looks more like the ST segment itself is inclined or distorted. Not really sure what to make of that, but no need to get caught up there.
Initial thoughts:
- no p-waves seen, but likely supraventricular in nature (i.e, not ventricular)
- bundle branch block (BBB) present
- possible ischemia with ST depression noted in inferior leads, but with concurrent BBB so that changes things a bit; maybe ST elevation in V2-V3; crew going to a PCI center anyways, so no need to delay on scene to think on it
- no need for immediate action or to change treatment plan
Report received was that EKG varied between this wide-complex rhythm and a narrow rhythm at the same rate, but that was not witnessed by crew.
Patient was alert and oriented, required a few liters of oxygen to maintain an SpO2 in the 90s, was hemodynamically stable on Norepinephrine at 5mcg/min.
That said, while en route there were a few things to consider:
- How to describe this rhythm?
- Which flavor of BBB is this? And does it matter?
- What to make of the ST depressions in the inferior leads?
- Is there anything else to be gleaned from the tracing?
To facilitate this investigation, the EKG was scanned into the PMCardio app. Which is a relatively new tool developed by the folks over at Dr. Smith’s EKG Blog. It uses a proprietary AI called The Queen of Hearts to identify OMI. Super rad and free to use, albeit in a limited capacity. Here’s the result:
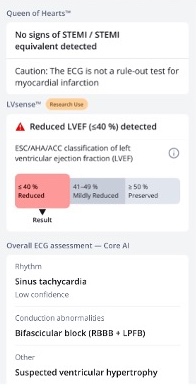
(This is also how we got the clean digital representation of the EKG scan we were given, just took a photo and PMCardio app did the magic.)
The rhythm interpretation itself (noted at the bottom) seemed fine and reasonable, although it isn’t 100% clear how to for sure identify the thing as a sinus rhythm without discernible p-waves.
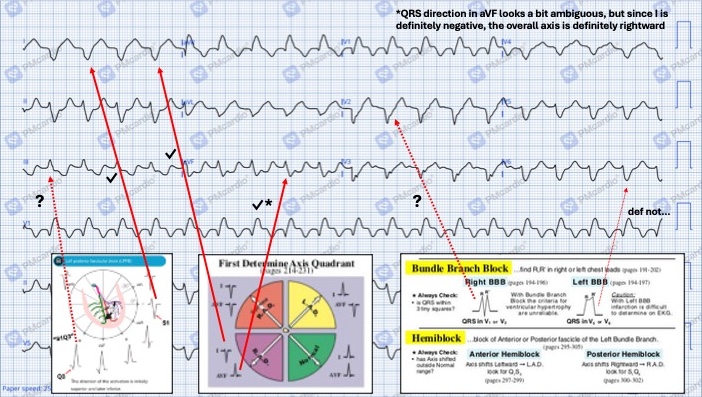
As for the BBB, the strip was identified as right-sided BBB (RBBB) with left posterior fascicular block (LPFB). Which, to be honest, is one of those things most EMS people (myself included…) don’t care too much about or know how to identify. So to fact check the PMCardio/ Queen of Hearts interpretation, this handy 12-lead EKG Cheat Sheet was used as a reference:
Specifically, this part on BBBs:
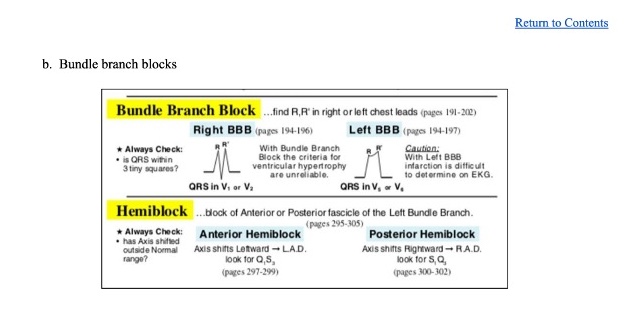
And just to be clear, that graphic that was included in the 12-lead reference is taken from Dubin’s EKG book. But don’t buy a copy, just borrow it off the internet…
As for the hemiblock noted in the automated interpretation, this is something often overlooked in the prehospital setting and perhaps best left to references or after-the-fact analysis. But the Q1S3 pattern for an anterior hemiblock or S1Q3 for posterior can be reviewed here:
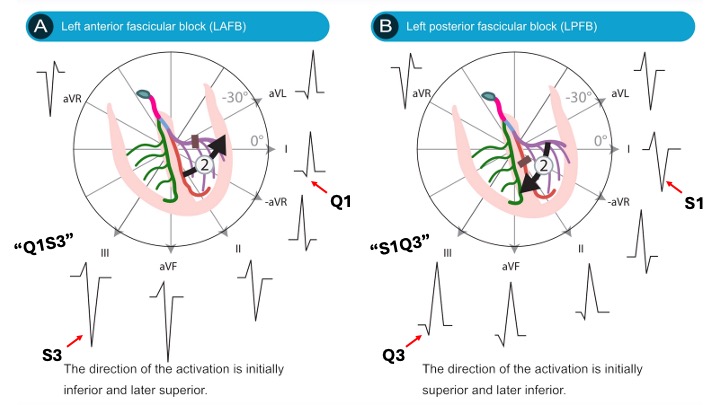
(As a sidenote: the plan is to include a graphic like this in the next version of that 12-lead EKG reference, as this case fleshed out that it was missing…)
And for a full discussion of all the ins and outs of fascicular blocks, take a look here: Elizari, 2019
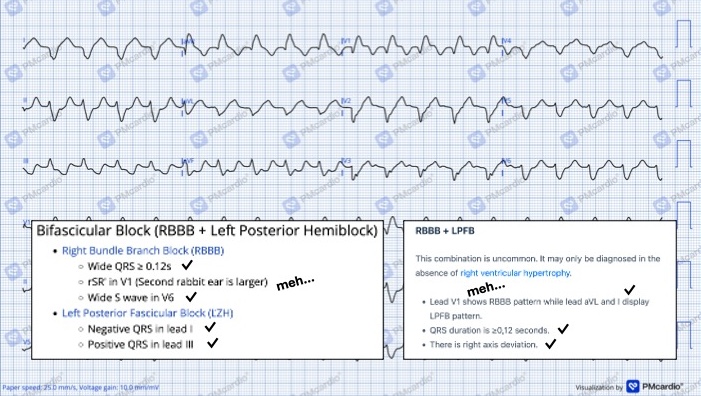
The AI calls it a RBB with LPFB, but not all of the findings we would expect are seen in the tracing:
That said, the pattern for RBBB + LPFB isn’t simply the stuff for RBBB plus the stuff for LPFB, as they interact a bit. Rather, it looks like this:
And then digging deeper into this, it does seem that a Q-wave in lead III is generally required for a diagnosis of LPFB. See Perez-Riera, 2018 for more on that idea. So either we have a very small Q-wave that we just can’t see or there is some other explanation for the rightward axis. Most likely would be right ventricular hypertrophy (RVH) due to some sort of chronic lung condition. Most often this is seen in V1 and V6:
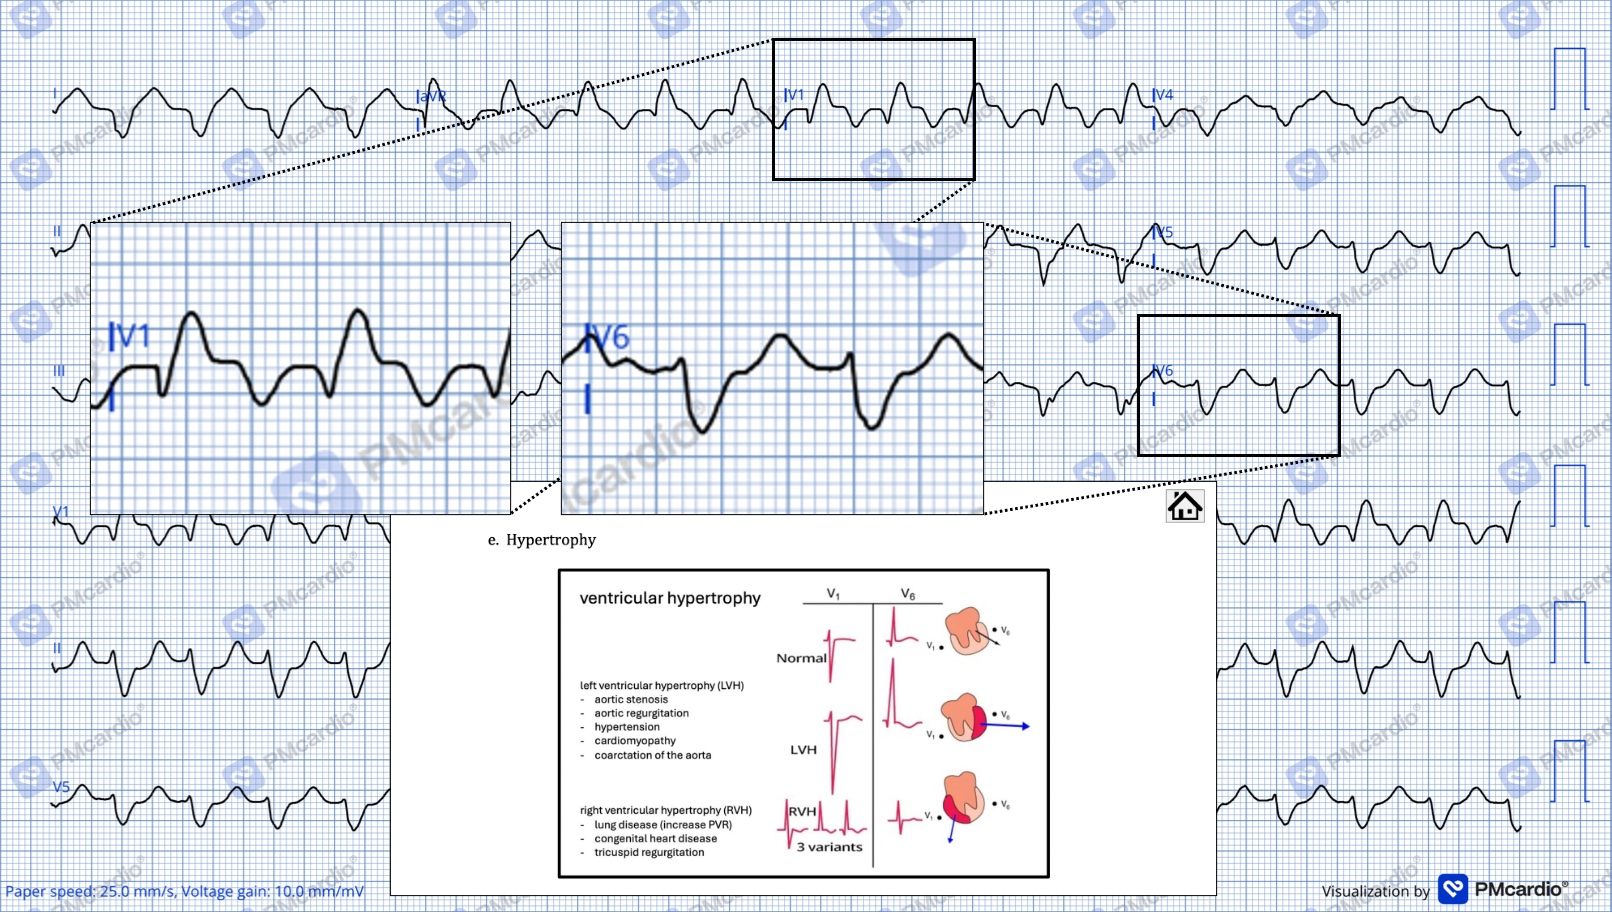
Fairly convincing in this example. Which would mean maybe not a bifascicular block, but rather RBBB + RVH. But no history of lung stuff was reported and it is unlikely that an elderly male has an undiagnosed congenital condition that would predispose him to RVH. He does, however, have both HTN & DMII (and is currently hyperglycemic, so likely not well-controlled) and there is quite a strong correlation between those things and RV dysfunction (as explained by Zhang & friends, 2024).
While at this point it is purely academic (since the patient was relatively stable and was being taken to a center with PCI for further testing by cardiology), let’s assume that the interpretation of RBBB + LPFB is true and discuss what that means.
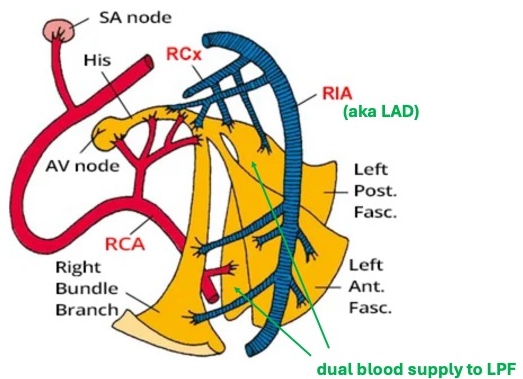
There are three main conduction pathways through the ventricles: RBB, anterior fascicle of the of LBB, and posterior fascicle of LBB). If two of three of those were blocked (i.e., have inadequate perfusion and, therefore, are non-functioning) this would be quite a significant finding. In addition, the LPF is generally considered more robust than the LAF because it is larger/ wider and has a redundant blood supply:
In this case it has been posited both the RBB and the LPF were blocked. Which is quite rare. And also pretty tenuous if it’s a new-onset thing.
One other fact that was passed on in patient report was that this wide-complex rhythm was intermittent. In hindsight, it may have been a good idea to request additional EKG tracings or press for more details. Specifically, was the change from wide to narrow rate-dependent? More on that idea of a rate-dependent BBB here.
Next thing to consider are those ST changes. In general, ST changes can be tough to interpret when there is a concurrent BBB. With new-onset LBBB, there are the Sgarbossa criteria:
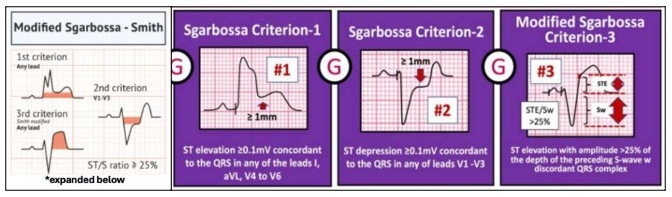
But for RBBB, with or without hemiblock, ST changes are typically assessed as they would be in any other EKG (i.e., same as in the absence of a BBB) with one major caveat: ST depression may be seen in V1-V3. To expand just a bit, discordant ST depression and/ or T-wave inversion can be caused by changes in depolarization/ repolarization. This idea is discussed both in this article by LITFL and this one by EMCases
So there’s a good chance that the ST depression seen in this example is not due to ischemia, but rather a consequence of the conduction abnormality. That said, if there is malperfusion to part of the conduction system, there very well may be impaired perfusion to part to the muscle of the heart itself also. This is why a high index of suspicion is warranted with new-onset BBBs in general.
Moving on and reviewing a bit of physiology, perfusion to the conduction system can be grossly oversimplified as so:
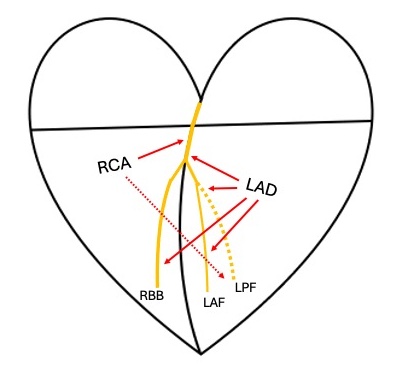
If the RBBB and the LPF were both blocked, it would correlate to the both the RCA and the LAD being affected. At least in this rudimentary framework. Even though there could be some variation to this pattern or collateral flow to accommodate for inadequate bloodflow, the potential for MI, abnormal cardiac function and acute heart failure (HF) here would be high.
On that note - one cool thing noted on the PMCardio interpretation is this “LVSense” note: “reduced LVEF less than or equal to 40% detected.”
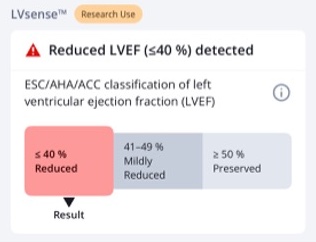
While this is still a concept in process with ongoing research, the idea is that AI can extrapolate a left ventricular ejection fraction (LVEF) based on the EKG tracing. There have been papers, such as this one from Bhattarai & friends, 2024 that look at correlating EKG findings to an estimate of EF. But newer studies, like this one by Carter & friends, 2026 look to outsource this analysis to AI models.
(This was the pre-print/ before-peer-review version of a 2025 paper, it’s just that the newer version is not freely available, so we linked this one. If anyone has access, let us know and we’ll update it here. Also academic paper should be free…)
In reference to the case at hand, the LVEF less than 40% correlates clinically - the patient needed hemodynamic support with Norepinephrine to maintain his BP. What isn’t clear is if there was an appreciable change from the patient’s baseline, narrow-complex rhythm. It would have been interesting to see what the LVSense said for that rhythm as a point of comparison.
Regardless, the patient was still in a state of acute HF, maybe also had some component of chronic HF as well. Even if we ignore the LVSense part of things, the patient had an extensive medical history with prior MI, required oxygen and vasopressors, and had conduction abnormalities on his EKG. Even though there was no overt evidence of ischemia or infarct, cardiac function was compromised.
In terms of treatment for this patient, care provided in transport was supportive - maintenance of oxygen and Norepinephrine, monitoring for further decompensation, etc. It is possible that the patient’s acute illness/ infection in the setting of cardiovascular disease and pre-existing HF resulted in the abnormal EKG seen (i.e., an acute change related to increased demand/ workload). While an in-depth analysis of the patient’s EKG didn’t necessarily change the plan of care, it does provide some interesting insight into both the pathology of conduction issue and the use of technology to evaluate EKGs in general.
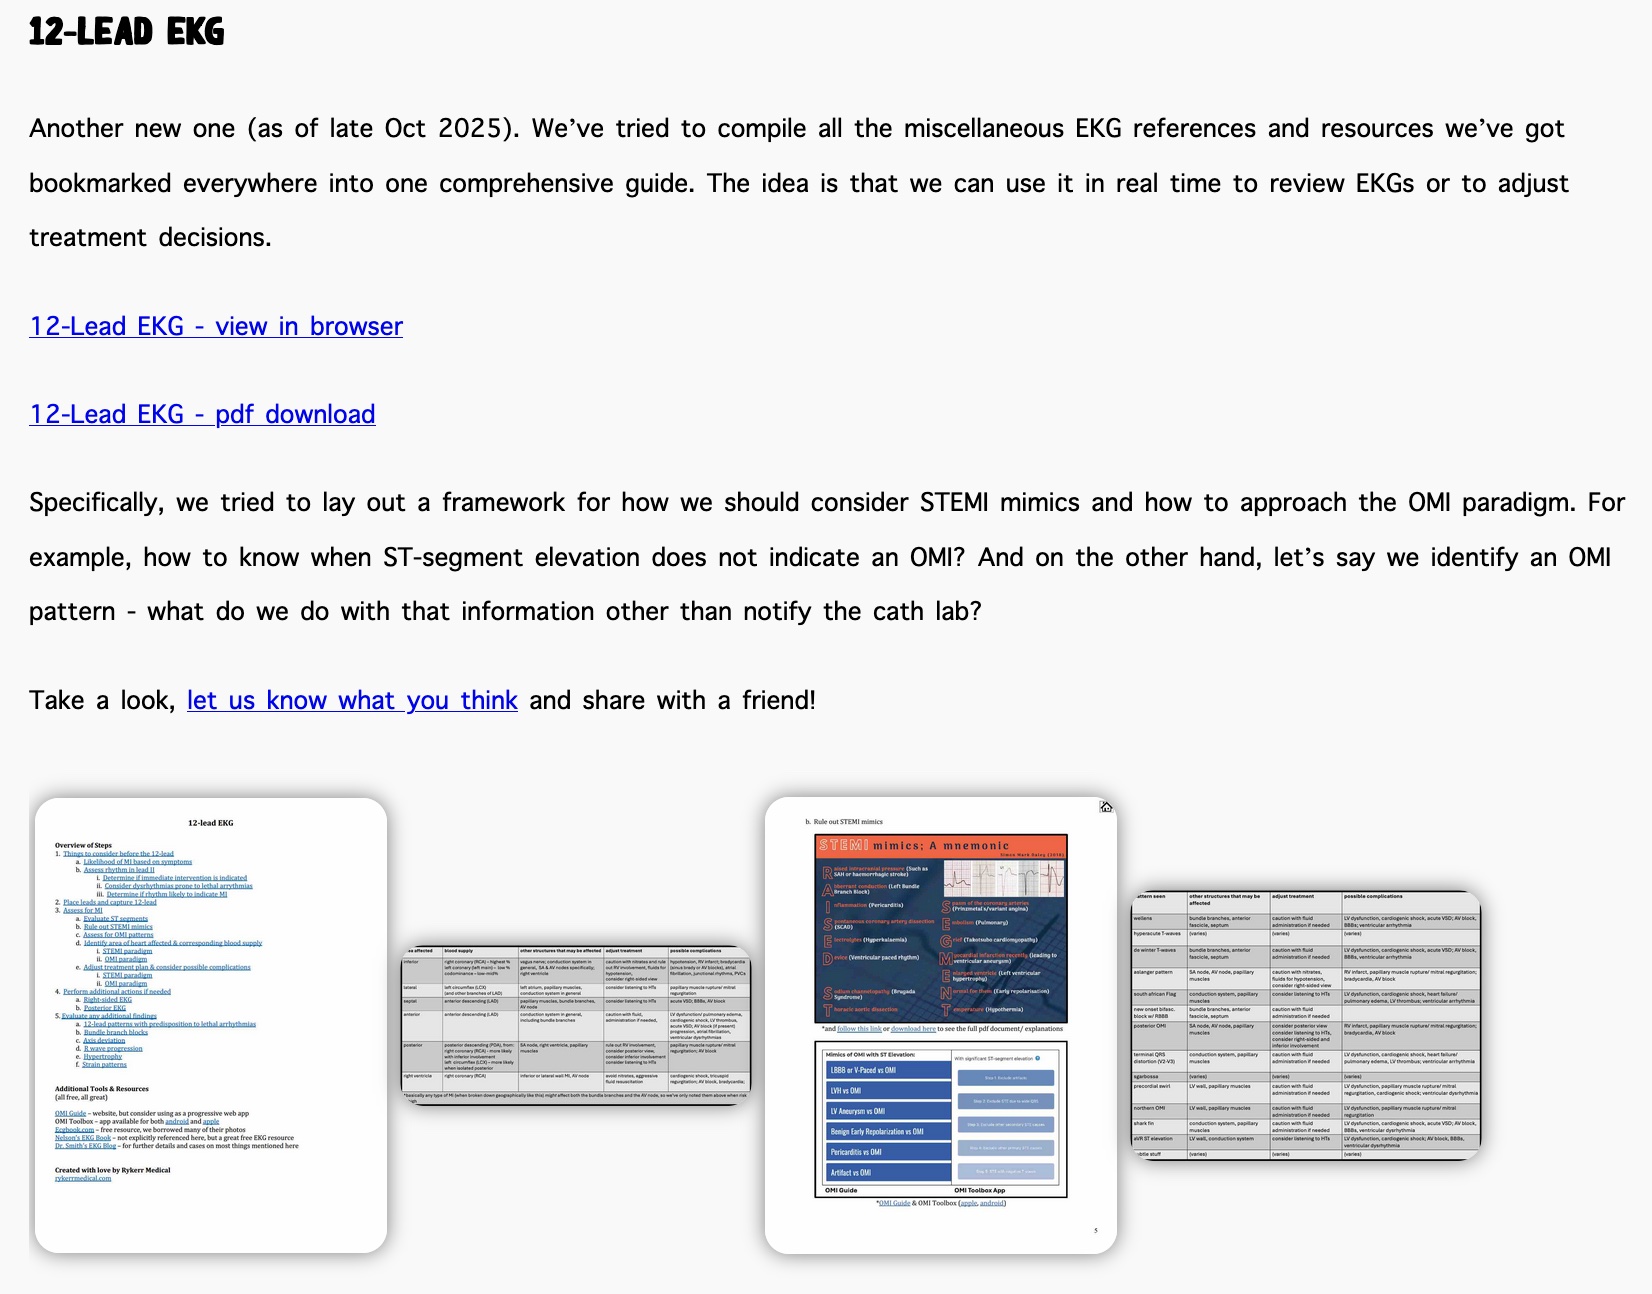
For those interested in this sort of thing:
- Rykerr Medical’s 12-lead EKG Cheat Sheet can be found here:
- PMCardio App
- EKG references in general